Contents
IntroductionGeometry
Hydrogen Bonds
Solvent Accessibility Surface
Displaying vectors
 |
CCP4 Molecular Graphics Tutorials | |
| Investigating a Structure |
| Documentation Contents | On-line Documentation | Tutorials | CCP4mg Home |
This documentation page has not been updated for CCP4mg 2.0. The page will be updated soon and will be available as part of the programs automatic update. If you have any queries meantime please contact ccp4mg@ccp4.ac.uk
Load any molecule of interest to you or use any one from the tutorial. It is easiest to work if the Display style is Bonds or Fat bonds.If you want to look at two or more homologous structures then the structures can be superposed - see the Protein Superposition tutorial. If you are looking at a new structure then some of the following selection and colouring tools may help you to familiarise
This section introduces some basic tools for interrogating the structure. From the Application menu select Geometry. A panel appears on the right side of the display window with a section titled 'Geometry'.
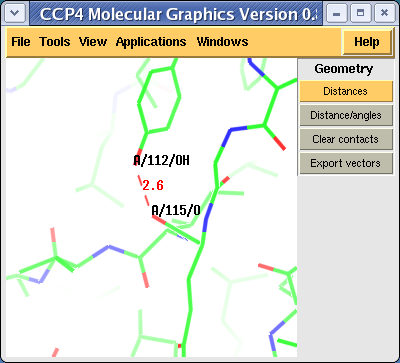
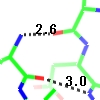
Try clicking on the Distances option and then, with the left mouse button click on pairs of atoms in the structure to show their inter-atomic distance. Note that the Distances button is highlighted in gold to show it is the active tool and the cursor is a cross to indicate that any atom picks will be used by the active tool. Now try clicking on the Distances/angles tool. A new window appears that will list the distances and angles between picked atoms. Pick a series of atoms and look at the information in the window.
Try clicking on an atom with the right mouse button and select the option Contacts around this.. and residue which will show close contacts around the selected residue (note that there might not be any close contacts). The cutoff distances for close contacts can be changed in the Geometry applications Preferences window which can be accessed by clicking, with the RIGHT mouse button on the Geometry title and selecting Preferences from the menu.
The contacts and distances can be cleared from the display by clicking the Clear contacts button. Individual contacts can be deleted by clicking on the contact dashed line with the right mouse button and selecting Delete contact.
If you want to include the contacts in an output image you may want to have more options on display style. This is possible if you export the contacts as vectors using the Export vector button - see Displaying vectors
To display the hydrogen bonds within the loaded model click on the dot icon next to the model name and from the menu select the Add display object.. option and from the sub-menu select Hydrogen bonds. Note also the Close contacts option on the same menu that has a very similar interface to the hydrogen bond interface that we are about to look at. Now all hydrogen bonds within the structure are displayed and, in the display table, an extra line appears under the model name. This line has an icon  , if you click on this one of the menu options is Label - select this and the sub-menu option Label bond lengths. From the same menu you can also select List/Save to file and a new window will appear listing all of the hydrogen bonds.
Several tools create similar windows; for example listing close contacts, secondary structure and the solvent accessibility. A couple of features of these windows are worth noting. Firstly, you can click on the Save to file option at the bottom of the window to save the listing to a file. Secondly if you click on an atom name (with the left mouse button) then that atom will be labelled in the main display window and if you double click on an atom name then the view will change to zoom in on that atom.
It is possible to display only the hydrogen bonds between two specified sets of atoms. The two sets of atoms are controlled by the menus in the Atom selection and Display style columns of the table. By default the atom selection is 'All'; click on this and change it to Main chain. The second set of atoms remains 'Same as selection' so only HBonds between main chain atoms are shown. Now try changing the 'Same as selection' to Side chains to see all HBonds between main chain and side chain atoms.
The criteria for HBonds can be changed in the Preferences window (on the Tools pull-down menu) - look in the Model analysis folder for Hydrogen bonds. The algorithm and parameters are explained in the Structure Analysis documentation.
If you want to include hydrogen bonds when creating an image you may want to have more options on display style or to be able to add or delete some bonds. These things are possible if you export the hydrogen bonds as vectors - see Displaying vectors.
The solvent accessible surface area is the surface area that is accessible to a 'water molecule'. In calculations the 'water molecule' is usually represented by a sphere of about 1.4Å radius (see Analysis documentation). To colour a model by the SAS area: from the Colour scheme menu select Residue property and then Solvent accessibility. There may be a short pause for the calculation and then the model is coloured with mostly blue on the inside of the model and red residues on the outside of the model. To see a colour legend click on the display object icon menu  and select Add colour legend. A legend appears at the bottom of the screen and an extra line also appears in the display table; it represents the legend object that can be manipulated in the same ways as any other legend object (for example click on the dot menu and select Delete).
Another option on the display object icon menu is List Residue solvent access. This will open another window listing the solvent accessibility of residues and atoms. The data can be saved by clicking the Save to File button. Also try double clicking, with the left mouse button, on any atom or residue name; the display will recentre on the atom or residue.
The parameters for the SAS calculation can be changed in the Preferences window (on the Tools menu); open the Model analysis folder and select Solvent accessible surface. There is little reason to change these but you may want to change the colour coding. To do this open the Model colours folder in the Preferences window and select Residue solvent access.
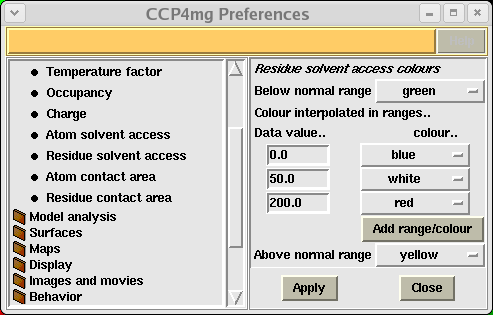
The window has a table showing the parameter value and the colour for that parameter value. Every residue on the display is given a colour, dependent on its SAS, which is interpolated from the fixed values and colours in the table. If a residue SAS falls outside the normal range of values in the table then it is given one of the colours, specified at the top and bottom of the window, for below or above the normal range. The 'outside normal range' colours are usually contrasting the normal colours in order to draw attention to outliers but they could be made the same as the normal range colours. Note that any solvent in your model is coloured green (or the below normal range colour) because it is usually excluded from the SAS calculation and assigned a value of -1.0.
Note that there is also an option to colour by atom SAS: from the Colour scheme menu select Atom property and then Solvent accessibility.
Generate a vector file by either
and select Export vectorsIn the file selection window enter the name for a vector file and make sure that the Load vector file button (at the top of the window) is clicked on. When you click the OK button the display window should not change significantly but a new vector object should be listed in the display window. The contacts or HBonds have been written to a file and then that file has been loaded and displayed in a similar style to the original data. To avoid confusion with the original data either
Now look at the new vector object in the display table and click on the middle column, labelled Line style/colour (the button is probably labelled 'red dashed' or 'white dashed') and try various options from the menu changing the line style and line colour. For example style dashed cylinder works well if your model is displayed as cylinders or ball and stick. You may want to change the cylinder radius and dash length.
Also try changing options on the Label style/colour menu.
After you have changed the appearance of the vectors it is advisable to save the changes to the vector file. (Note that, unlike say model coordinate files and map files the vector file can contain information on how you would like the data to be displayed). To save the file click on the dot and select List/save to file from the menu. A new window will appear listing the vectors and their appearance (the format is explained in the Vector documentation). Click on the Save to File button at the bottom of the window to save this listing.